Why a September cut isn't good news for the US economy
- James McKay
- Aug 31, 2024
- 6 min read

Mainstream commentary on the US economy has flipped optimistic, with assurances that a recession can be avoided with a 'soft landing' now in view. Of course, these narratives align nicely with the consensus that the FED will likely cut interest rates by 25 basis points in September, with a 50 bps cut also on the cards as headline inflation (CPI) continues to cool and fiscal conditions tighten.
While some suggest that the upcoming rate cut signals the economy has moved beyond its pandemic-era struggles, there are simply too many indicators pointing in the opposite direction to overlook. Here, we’ll provide a high level overview of what some of these metrics say for a view on why the current "recessionless recession" may soon cede to an actual recession moving ahead.
Inverted yield curve returning to normal
The Treasury yield curve which plots two-year and 10-year US treasury yields is one of the most tried and tested "recession ahead" indicators, and traditional markets typically face uncertainty and an uptick in volatility during yield curve inversion.
Yield curve normalisation following an inversion is often a strong signal that a recession is imminent. Historically, an inverted yield curve—where short-term interest rates exceed long-term rates—has accurately predicted the last three US recessions (seen in grey in chart below). Once the curve returns to normal, it often indicates that economic damage has already been set in motion, with recessions typically following soon after as growth slows and financial conditions tighten.

As shown in the chart, the yield curve is now sharply correcting upward after being inverted for a record 548 days having first dipped into negative territory in early July 2022. This strongly suggests that the upcoming September rate cut will likely not be enough to stave off a recession.
Unsustainable national debt
The national debt and its impact on the economy cannot be overlooked, and having just topped $35 trillion for the first time in July, this bloating burden is a reminder of the nation's grim fiscal predicament. Indeed the total debt held by the public as well as debt held by federal trust funds and other government accounts is increasingly gobbling up ever greater portions of fiscal firepower.
For example, the interest payments on this federal debt swelled to 76% of all personal income taxes for the month of June. In other words, more than three-quarters of the government's largest source of revenue is being wiped out by interest payments. As seen in the chart below, federal debt servicing has recently surpassed spending on both defense and medicare.

Additionally, the most recent projections made by the Congressional Budget Office (CBO) show that interest costs will reach $892 billion in 2024. This is a jump of 36% from the previous year and follows increases of 35% and 38% in each of the two previous years.
The CBO predicts further that over the next 10 years, the US government’s interest payments on the national debt are projected to total $12.9 trillion. This is the highest dollar amount for interest in any historical 10-year period and more than double the total spent in the last two decades.

As can be seen in the chart, relative to the size of the economy, interest costs would reach 3.4% of GDP in 2025 — eclipsing the previous high set in 1991. Interest costs would climb to 4.1% of GDP by 2034.
We can also see that:
➡ Net interest costs would rise from $890 billion in 2024 to nearly $1.7 trillion in 2034. The previous inflation-adjusted high was $468 billion in 1996.
➡ As a share of federal revenues, federal interest payments would rise to 20.3% by 2025, exceeding the previous high of 18.4% set in 1991. They would continue climbing to 22.9% by 2034.
➡ As a percent of total spending, interest costs would reach 15.8% by 2031, eclipsing the previous high of 15.4% set in 1996.
This is obviously unsustainable and we'll see all sorts of distortions should this trend continue, not least of which are the crowding out of private investment, and a potential loss of confidence in the bond market. As we will see, these debt trends are also unfortunately not limited to the federal government.
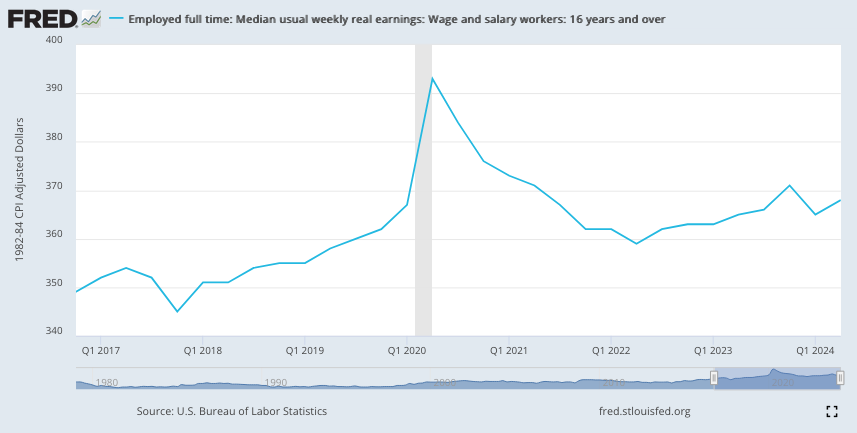
Real wage growth stagnation
While the FED's aggressive rate hikes to curb inflation squeezed consumer budgets, real wage growth (wages adjusted for inflation) declined sharply since 2021 and have since stagnated. In simple terms this means that inflation has outpaced wage growth, leaving many Americans worse off in real terms than they were a few years ago. People are earning more on paper, but their purchasing power has eroded, leading to a decline in discretionary spending. And with around 70% of US GDP consisting of consumer spending, this is obviously a serious concern.
Where this pinch in household budgets shows up is in credit card debt and savings. As of 2024, Americans' credit card balances reached a new record high $1.13 trillion, as people rely more on borrowing to cover everyday expenses. At the same time, personal savings rates have plummeted to historic lows, leaving many financially vulnerable. This combination signals growing economic strain, as rising costs outpace wage growth and households struggle to make ends meet.

Unemployment rate vs Labor Force Participation Rate
In August, the BLS revised down its US jobs by 818,000 (about 68,000 per month) which marked the largest downward revision since 2009.
There's now much debate on to what extent these numbers are a harbinger of an impending recession, or if the revision itself was overstated and bound to be corrected in the opposite direction in the next report (which happens roughly 60% of the time).
But to get another view of the broader US labour market, we can look at the Unemployment Rate vs Labor Force Participation Rate (LFPR); the latter which differs from unemployment by including both employed individuals and those actively seeking work relative to the entire working-age population. This offers a broader view of who is actually in the labor force.

After a sharp spike during Covid, the unemployment rate returned to pre-pandemic levels roughly over a two-year period. By contrast, the LFPR hit a 50-year low a decade ago, was flat until the pandemic, then collapsed, and has since staged an anaemic recovery back to said 50-year low.
The fact that the LFPR remains sitting at the 50-year lows is a troubling sign for the US economy because it means fewer working-age Americans are participating in the labor market. People who have stopped searching for jobs due to discouragement or other reasons (early retirement or caregiving responsibilities etc.) are not reflected in the unemployment rate, but they do affect the LFPR. In other words, the LFPR can indicate a rising number of these 'hidden unemployed' even if the official unemployment rate is low.
Following on from this, we must pose the following (rhetorical) question: can we think of any government policy that may have contributed to further disincentivising individuals from looking for work in the last few years?
Either way, no part of this picture supports the notion of 'record jobs creation' often cited by the current administration and the implications for the economy are obvious, as stated above: Consumer-driven economy + declining labor force participation = economy no grow.
Rate cut will not fix endemic structural problems
The above data points above are but a small cross-section of measures that suggest that, while a rate cut may offer short-term relief to house holds, businesses, and the government, it's clear it won't be a silver bullet for the deeper, more structural issues plaguing the US economy. Record-high credit card debt, declining savings, a fragile job market, and bond market signals all point to systemic issues that can't be solved by monetary policy alone.
This is particularly the case given the current fiscal dominance environment where continued inflationary pressures imply the need for higher rates while escalating government debt servicing expenditures absolutely necessitate lower ones all the while consumers continue to feel the squeeze. Without serious attention to these deeper challenges, the risk of a recession remains not just a possibility, but a growing inevitability.
For more information about our custom research services please get in touch directly, contact us here. Download our latest featured report below.
Disclaimer: The information contained within is for educational and informational purposes ONLY. Any commentary provided is the opinion of the author and should not be considered a personalised recommendation. The information contained within should not be a person's sole basis for making an investment decision. Please contact your financial professional before making an investment decision. No commercial relationships or partnerships exist with any of the technology providers, manufacturers, or suppliers herein.


Comments